- PDF
User interface insights
- PDF

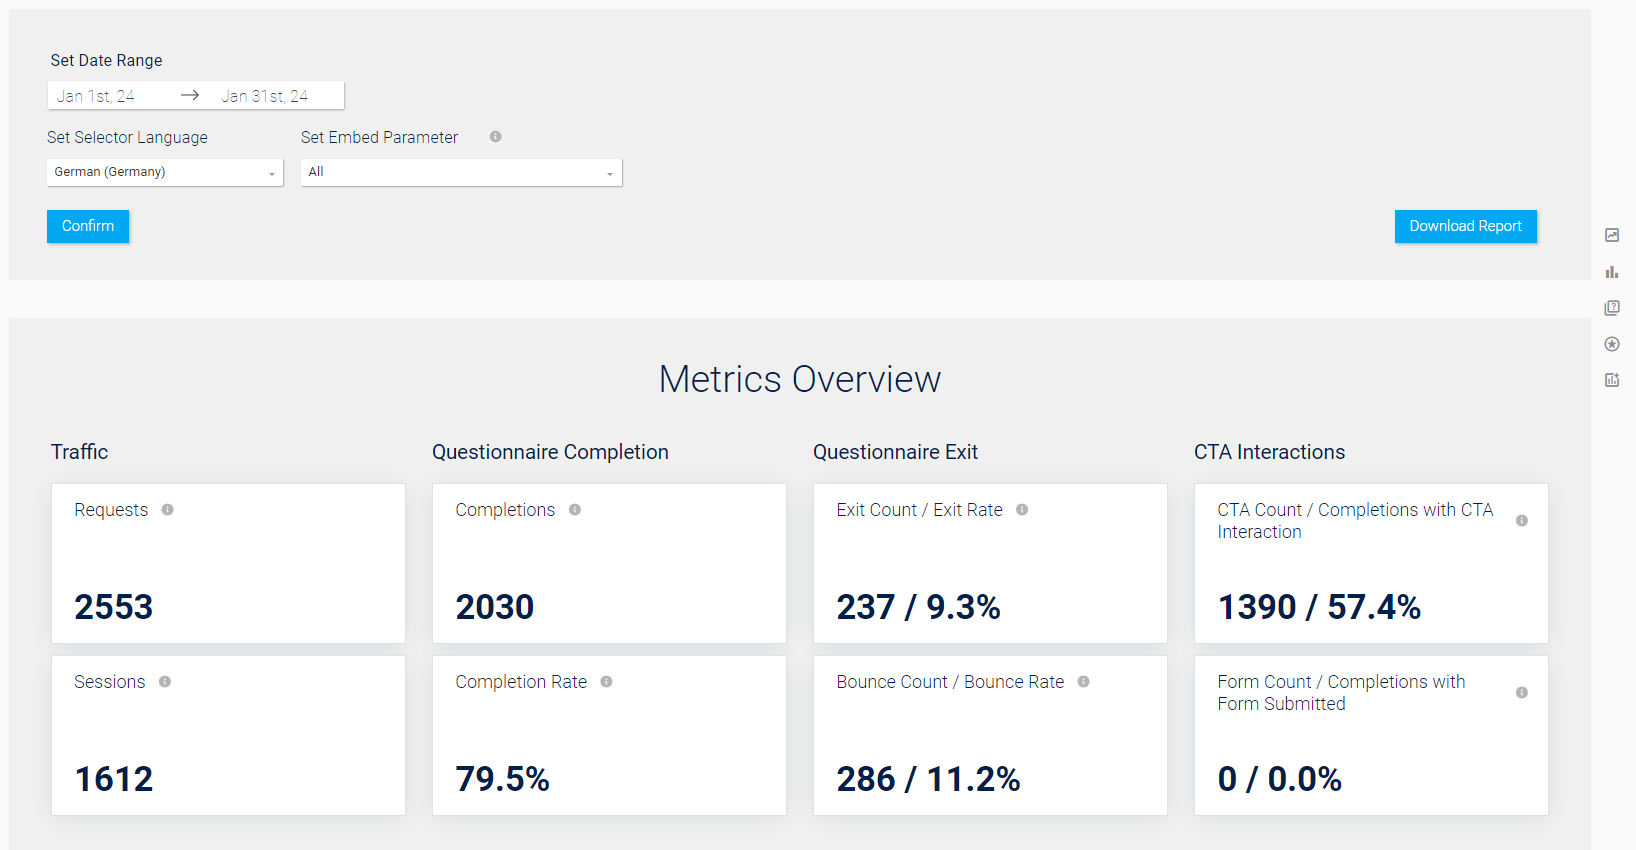
Set Date Range: Select the analysis period you want to view.
Set Selector Language: Filter insights by language.
Set Embed Parameter: Filtering of insights according to embed parameters.
All: The data for all parameters is displayed in a bundle.
No embed parameter: Only fields that explicitly do not contain an embed parameter are displayed.
💡 Sessions and bounce count / bounce rate are not indicated
If a specific embed parameter or the option No embed Parameter is selected, no data for sessions and bounce count / bounce rate can be specified. This is why you will see the Excluded label in the overview when you select these options. With this setting, the requests are also calculated from exits + completions instead of the usual exits + completions + bounces.
Confirm: After the configuration of Set Date Range, Selector Language and Embed parameters, confirm your selection.
Download report: Export of the Insights data as an Excel file.
Metrics Overview: Graphical overview of relevant parameters such as the completion, bounce and exit rate.
Traffic
Requests: Number of requests. A request starts when the selector is called via the browser - also calls where no response is clicked count as a request (see bounce rate).
Sessions: Number of users who have opened the selector.
A user can trigger several requests within a session. This is the case, for example, when a person goes through the selector and then clicks on Restart on the results page. The restart triggers the new query (i.e. the request).
Questionnaire Completion
Completion: Number of people who have answered the questionnaire in full and reached the results page.
Completion rate: Percentage of queries for which all questions were answered and the results page was reached.
Benchmark: The completion rate should be above 85%.
Questionnaire Exit
Exit Count / Exit Rate
Exit count: Number of visits in which users answered at least one question but left the selector before reaching the results page (number of abandonments).
Exit rate: Percentage of visits in which users answered at least one question but left the selector before reaching the results page (abandonment rate).
Benchmark: The exit rate should be below 10 %.
Insight: A high exit rate is a sign that the question tree may have been formulated too complex or too long and that users are overwhelmed at some point.
-
Bounce Count / Bounce Rate
Bounce Count: Number of visits where users have left the selector without answering a question.
Bounce rate: Percentage of requests that left the selector without answering the first question.
Benchmark: The bounce rate should be below 7%.
Insight: A high bounce rate is a sign that the first question may have been formulated incomprehensibly or that the user arrived at the page with the selector with the wrong expectations (traffic quality).
CTA Interactions
💡 Set up CTAs and measure success using KPIs
First set up call-to-action elements on the results page to measure the associated KPIs. With CTAs such as PDF downloads or contact forms, you offer your customers decisive added value and take the user journey to the next level.
CTA Count / Completions with CTA Interaction:
CTA Count: Number of call-to-action (CTA) elements clicked on the results page.
Completions with CTA Interaction: Percentage of completed requests for that interacted with at least one CTA on the results page.
Benchmark: The share should be above 20 %.
-
Form Count / Completions with Form Submitted
Form Count: Number of contact forms sent.
Completions with Form Submitted: Percentage of all completed requests for which at least one contact form was submitted.
Benchmark: The ratio should be above 50 %.

